
В человеческих популяциях изменения генетической изменчивости обусловлены не только генетическими процессами, но также могут возникать из-за культурных или социальных изменений. Tian Chen Zeng, Alan J. Aw & Marcus W. Feldman изучали изменение разнообразия Y-хромосом мужчин в неолите. Их исследования показали резкое снижение в популяциях нескольких стран Африки, Европы, Азии 5000-7000 лет назад количества мужчин оставлявших потомство. Данные по митохондриальной ДНК (она передаётся только по женской линии) никакого падения численности не показали, — напротив, они демонстрировали постоянный рост.
Авторы исследования предложили социокультурную гипотезу, объясняющую это формированием патрилинейных семейных групп и межгрупповую конкуренцию между этими группами. Проще говоря, появление у вождей гаремов и безбрачие подавляющего большинства рядовых общинников, которых использовали как воинов в частых войнах, где они и гибли.
Соотношение размножающихся мужчин и женщин в популяциях упало до 1 к 17. Ничего подобного в исторические времена (более поздние, описанные в письменных источниках) нигде не зарегистрировано.
Как отмечают исследователи, сценарий мирной экспансии, при котором мужчины одной генетической группы просто оставляют больше потомства, например, если в их обществе уже есть земледелие, а у конкурирующей групп нет, нереален. Из археологии известно, что ещё за пару тысяч лет до V тысячелетия до нашей эры во многих районах Евразии уже был неолит и сельское хозяйство. То есть опередить в размножении за счёт земледелия никто никого не мог, благо земледелие было у многих.
Для того чтобы такой массовый геноцид мужского населения работал, в обществе должна сложиться патрилинейная клановая система, при которой родство считается по мужской, а не по женской линии. Таким образом, генетические данные указывают на формирование такой системы уже к V тысячелетию до нашей эры.
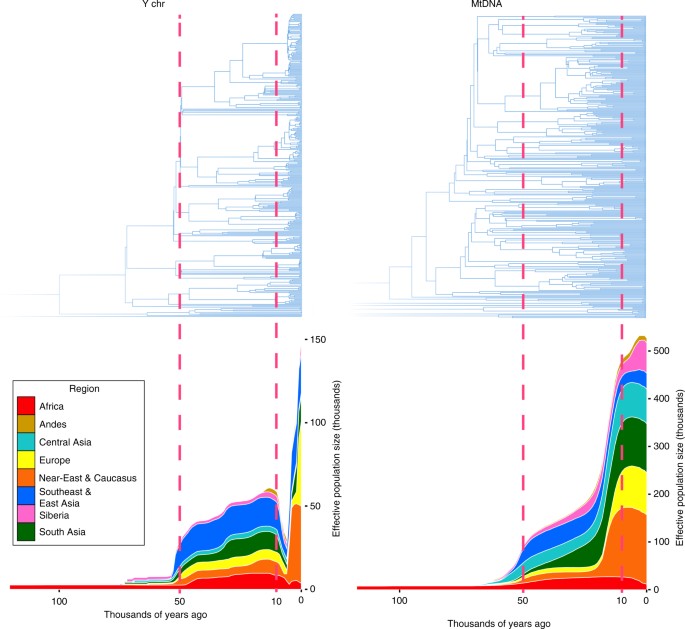
Cumulative Bayesian skyline plots of Y-chromosome and mtDNA diversity by world regions. Reprinted from Karmin et al.4 with permission from Monika Karmin and under a Creative Commons License (Attribution-NonCommercial 4.0 International)
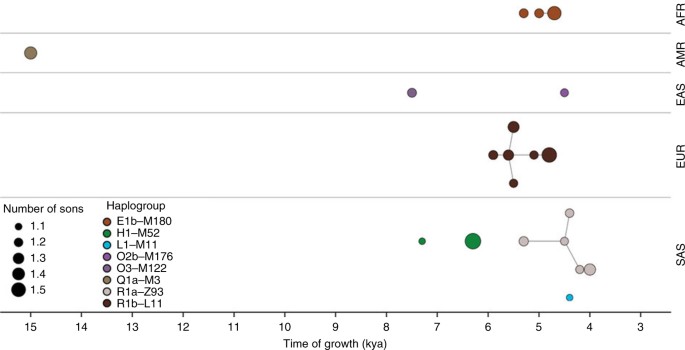
Explosive male-lineage expansions of the last 15,000 years. Each circle represents a phylogenetic node whose branching pattern suggests rapid expansion. The horizontal axis indicates the timings of the expansions, and circle radii reflect growth rates, namely the minimum number of sons per generation, as estimated by a two-phase growth model of Poznik et al.6. Nodes are grouped by continental superpopulation (AFR: African, AMR: admixed American, EAS: East Asian, EUR: European, SAS: South Asian) and coloured by haplogroup. Line segments connect phylogenetically nested lineages. Reprinted from Poznik et al.6 with permission from Carlos D. Bustamante and Nature Publishing Group
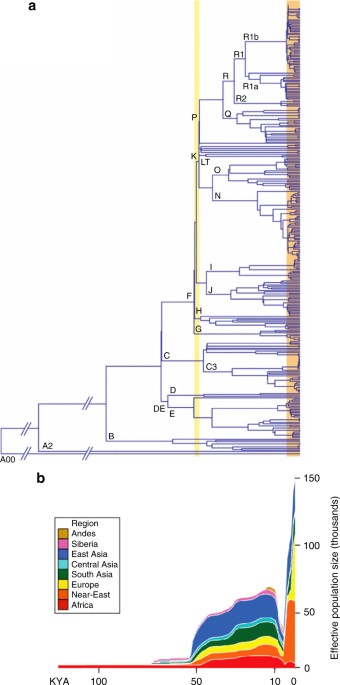
Male-specific Y (MSY) chromosome phylogeny from next-generation sequencing data, and associated demographic reconstruction. a MSY phylogeny based on 456 samples and 35,700 SNPs. Major haplogroups are labelled. The orange box highlights recent expansions identified in several haplogroups, and the yellow box highlights more ancient expansion of deep-rooting lineages. b MSY Bayesian Skyline Plots (of effective population size against time), with different world regions indicated by colours as shown in the key. Reprinted from Batini and Jobling78 with permission from Mark A. Jobling and Springer Science+Business Media
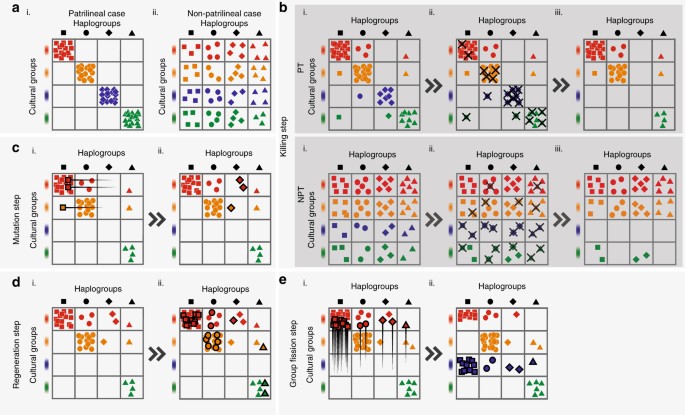
Schematic of the steps in the simulation, according to the order described in the algorithm. a (i) Patrilineal (PT) starting conditions, where cultural groups strictly determine haplogroup type. a (ii) The non-patrilineal (NPT) condition where they are perfectly uncorrelated. b The killing step, with a more (PT) and less (NPT) patrilineal starting condition. The number of deaths in each group is inversely related to group size. The blue cultural group goes extinct in both cases. This causes the haplogroup represented by the diamonds to go extinct in PT, but no haplogroup extinction occurs in NPT. c The mutation step, where a small number of individuals in the largest haplogroup change their haplogroup. d The regeneration step, where (i) is a replica of (b) PT (iii), and (d) (ii) shows how the original number of individuals before the killing step is restored by proportionally increasing the number of individuals in all cells. e Group fission step. Where an empty row occurs, the largest cultural group splits, and half the individuals form a new cultural group in the empty row. The step in which we remove cultural groups that are too small—between (c, d) (see Methods)—is not shown
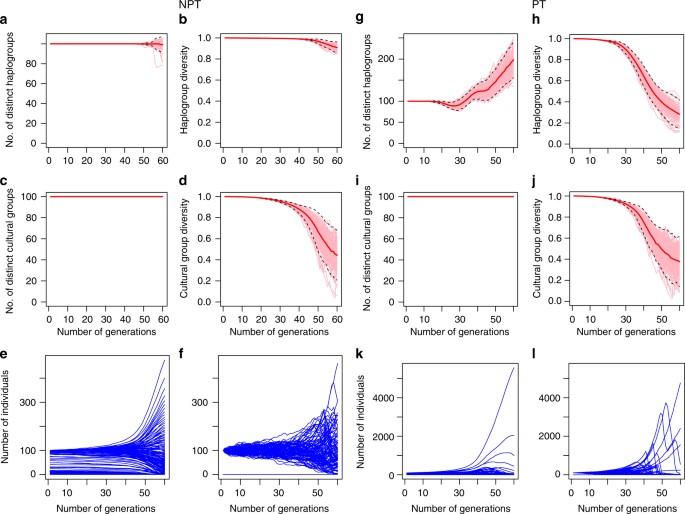
Cultural group and haplogroup dynamics in competing completely non-patrilineal groups (NPT) and in competing patrilineal kin groups (PT). These correspond to Figs. 2 and 3 of Supplementary Note 3. There are 100 cultural groups, or ‘tribes,’ each with size 100 at the beginning, and 500 possible haplogroups. Dynamics of the number of distinct cultural groups, cultural group diversity, the number of distinct haplogroups and haplogroup diversity are obtained by averaging over 100 simulation runs (details in Supplementary Note 3). Left panels: a Number of distinct haplogroups. b Haplogroup diversity. c Number of distinct cultural groups. d Cultural group diversity. Each graph consists of 100 pink trajectories representing 100 distinct simulation runs, and one thick solid red trajectory representing the average of the 100 pink trajectories. Black dotted lines representing confidence intervals covering two standard deviations from this mean trajectory. Note that the total number of haplogroups does not increase in this model as each haplogroup-cultural group pair has too few representatives for the mutation step of our algorithm to operate on; this is a methodological artifact and not a significant result. e The mean dynamics of the size of each of the 500 haplogroups over T = 60 generations. f The dynamics of each of the 500 haplogroups for one single run. Right panel: g–j Dynamics for the patrilineal configuration, correspond to a–d of the non-patrilineal configuration. Similarly, k, l correspond to e, f
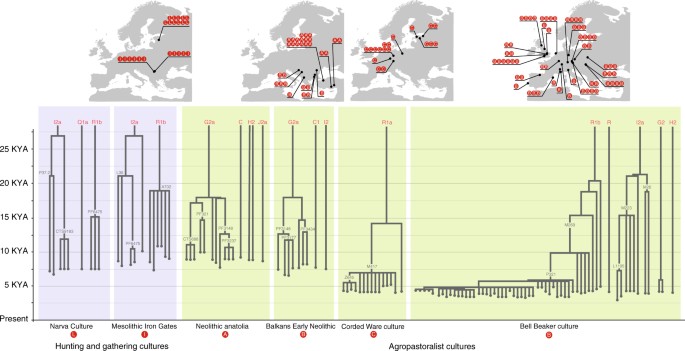
Tree of Y-chromosome genotypes from samples found among cultures with hunter-gatherer subsistence, and agropastoralist subsistence. The blue background represents hunter-gatherer subsistence while the green background represents agropastoralist subsistence. Letters in red circles match individuals from sites with their archaeological context. Note that R1b-P321 is synonymous with R1b-S116. Adapted from Figs. 3, 4, 5 and 6 of Kivisild67, with addition of information from Olalde et al.64. The vertical axis represents time; the position of branch points represent the ages of branch-defining mutations, with nomenclature and age from yfull (https://www.yfull.com/tree/)
Соответствующая статья опубликована в Nature Communications.
**********
И ещё один вывод не сделанный авторами исследования, но явно вытекающий из него: В это время на Земле существовала единая цивилизация. Иначе не могло быть такого единства культур. Такая цивилизация известна. Это Цивилизация мореходов – строителей мегалитических сооружений дольменов, пирамид, лабиринтов. (1, 2, 3, 4, 5, 6, 7, 8, 9, 10, 11, 12, 13, 14, 15, 16, 17, 18)